Near the picture is written:
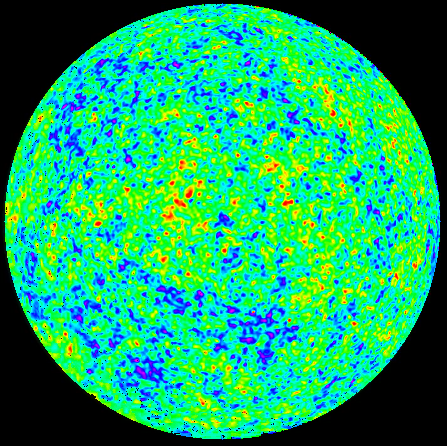
The entire observable Universe is inside this sphere, with us at the centre of it.
It should be mentioned that the observed sphere of photons is not a physical object, it has no distance. The observed sphere is something like the night sky. The same with observable Universe.
The total Universe (The present state of all matter and more, originating at the the Big Bang) is a huge physical object. The origin of CMB radiation is a small physical object. Its shape is a sphere but only the thick surface is considered. The total Universe at that moment was slightly larger.
Near the picture is written:
- The article
Cosmic Symphonie from Scientif American at page 51 "The power spectrum" shows a similar sphere.
Together 4 images are shown of the CMB radiation observed from 4 different angles: 64 degrees, Large, Intermediate and Small.
-
When you visit the following url: CMB Power Animations you will see a continuous range of simulated CMB radiation images going from large angles to small angles.
Comparing those with the 4 images in the Scientific American reveals that they are the same.
This leads to the following conclusion The 4 images in the Scientific American article are not directly based on observations - This means that both the spherical CMB radiation image in the BBC article and in the Scientific American are based on observations.
-
This raises the following questions:
- How is the CMB Power Spectrum calculated from observations.
- What is the most current observed CMB radiation spherical image?
- How many of those images are there ?
- How is the CMB Power Spectrum calculated from observations.
- To answer the first question.
- Starting point is one circle on the sphere (something similar like the equator). This circle represent a line of pixels covering a range of 360 degrees.
However that is not what you are going to use. What you need are the measured photon intensities for the positions on this circle.
- The second step is the calculation of an autocorrelation at an angle l. That means the multiplication of the intensity at a certain angle at the circle with the intensity a certain angle l futher away. And this for all the angles of the full circle.
- The third step will be to perform the same for all different types of l. The result the power spectrum as a function of l (I assume)
- The fourth step will be to do the same for different circles.
- Starting point is one circle on the sphere (something similar like the equator). This circle represent a line of pixels covering a range of 360 degrees.
However that is not what you are going to use. What you need are the measured photon intensities for the positions on this circle.
Figure 1 at page 3 and Figure 2 at page 8 from the Nine year WMAP observations shows the most current CMB Power Spectrum.
My rough guess is that the Power Spectrum (The continuous line) is a Calculated Power Spectrum and probably calculated with the program CAMB. (CMBFAST in the past). The Power spectrum also shows small vertical lines. I expect that those lines reflect what is observed, i.e. what is calculated based on the observed photon density.
What I want to understand is how are those vertical lines calculated? Why are they not evenly spaced?
There is one more complication to all of this.
When you goto the end of the document: Max Tegmark's library: saskmap you will see a rainbow. Technically each color is a combination of three colors: Red, Green and Blue. In reality to display each color on two are used. The left color is a combination of Red and Blue. Yellow is a combination of Red and Green. In short always one color is zero. What is even stronger always one color has the value 255. White has the combination 255,255,255. Black has the combination 0,0,0.
When you test all the images in that same document this is the same: Always one color is zero, always one value is 255.
When you consider this spherical image this is not true: Max Tegmark's Home. The picture is blurred. One color that is added is black to make it look round. That means the original data is modified. Why?
We live in an interesting world.
|
De above picture is reproduced with the program the Visual Basic 2010. For a review of VB 2010 read this: Visual Basic 2010 Evaluation and Criticism. For a copy select the author.
-
Is it possible, only by using the data presented in this image, to calculate the Cosmological Constants (Including the age of the Universe) ?
At the same time you should also try to answer the following question:- Is it possible to calculate what happens inside the sun by observing the outside
Is there a difference between hot spots and cold spots within the same geometry?
Go to the paragraph: "Are the Boomerang and WMAP Data Important?"
There you can read:
Next you can read:
Consider yourself at the center of the night sky and that the sky is covered with hot and cold spots. The following 3 diagrams show this.
                HHH
             |       |
        C    |       |     C
      C      |       |       C
    C        |       |
   ______    |       |           H
 H       \    \     /             H
          \    \   /            __
H          \    \ /            /   C
H           \_  | |   ________/    C
 ____________ Observer________     C
C    ________   | | |         \    C
C   /           | | \ \        \__ C
 C /            | |  \ \
                | |   \ \
   H            | |    \ \       H
                | |     \ \_____
      C        /   \     \
              /     \     \ C
           H /       \ H
                CCC

              Closed Universe
|
                 HHH
                  |
         C        |        /C
       C \        |       /    C
     C    \       |      /
           \      |     /         H
  H         \     |    /           H
             \    |   /
 H            \   |  /              C
 H             \  | /               C
  ____________ Observer_____________C
 C             /  |  \              C
 C            /   |   \             C
  C          /    |    \
            /     |     \
    H      /      |      \        H
          /       |       \
       C /        |        \
                  |         \C
            H     |     H
                 CCC

            Flat Universe
|
                 HHH
              \       /
         C     \     /     C
       C        \   /        C
     C           | |
    \            | |             H
  H  \           | |              H
 H    \          | |      ________
 H     \         | |     /         C
 H      \______  | |   _/          C
  ____________ Observer_           C
 C         ___   | |    \          C
 C        /      / \ \ \ \________ C
  C______/      /   \ \ \_____
               /     \ \      \
    H         |       | \      \  H
              |       |  \      \
       C      |       |   \
              |       |    \ C
           H  |       | H
                 CCC

            Open Universe
|
For the hot spot above they bend towards each other.
But this creates a problem: If they bend towards each other for the hot spots than for the cold spots they have to behave different, implying that they have to bend away. This is shown in the above sketch.
The problem with the bending of light rays is that consider the full sky that not all the light rays can bend towards each other nor that all the lightrays can bend away from each other.
The image in the center of a flat Universe does not have this problem.
The bottom line is that the size of the hot and cold spots is no proof that the Universe has an either open close or flat geometry.